Page Contents
The Boundary Survey Pegging Plan
A boundary survey plan or pegging plan is usually provided by your land surveying firm at the completion of a licensed boundary survey of your property.
The plan explains exactly where your boundary is located in relation to any fences, buildings or other occupation on or near the boundary.
However, if you have never seen one of these plans before the information shown on the plan may be a bit overwhelming and hard to understand.
The aim of this article is to clearly explain the most common features of your boundary survey plan to help you understand what is being shown by your licensed surveyor.
Our Example Plan
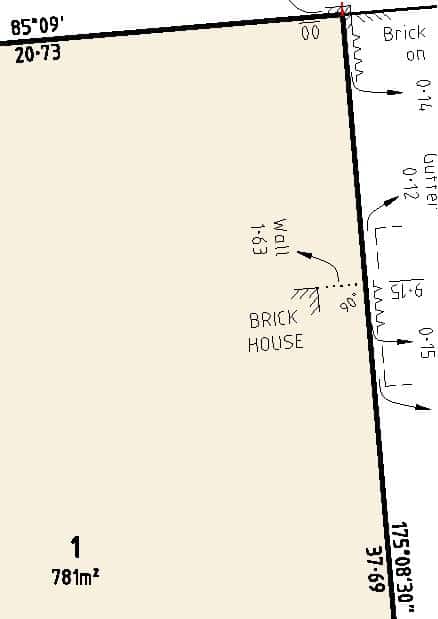
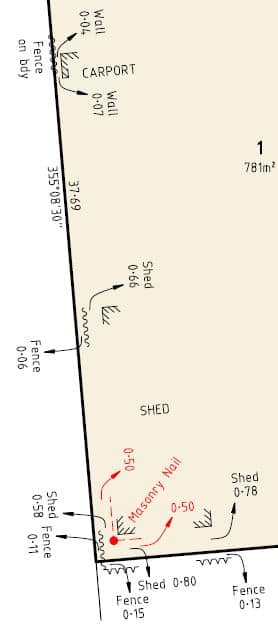
The image provided below is a typical example of a boundary survey pegging plan which shows:
- Land Dimensions and Boundary Orientation
- Land Area
- Land Parcel Details (Allotment and Survey Plan Number, Certificate of Title)
- Survey Marks Placed
- Boundary Occupation (i.e. fences, walls, structures)
- This data shows encroachments if applicable
- North Point
- Neighbouring Land Identifiers
For more detail on the sections of a boundary survey pegging plan please continue reading!
[mc4wp_form id=”647″]
Land Dimensions and Boundary Orientation
Along the centre of the solid bold lines (the boundary your property), you will find two sets of numbers in bold text; the dimensions of the boundary and the orientation of the boundary relative to true north.
Boundary dimensions are shown in metres, the orientation of the boundary is shown in degrees(°), minutes(‘) and seconds(“).
In our example, the image shows our northern boundary (the top of the page) and our eastern boundary (right hand side of the page).
The length of the boundary at the top of the page is 20.73 (metres). The boundary on the right hand side has a length of 37.69 (metres).
The top boundary is 85°(degrees) and 09′(minutes) from true north. The orientation of the boundary is generally useful in determining if your block is truly rectangular of if the corners of the allotment are not exactly 90° (degrees).
The boundary on the right hand side has an orientation of 175°(degrees) 08′(minutes) 30″(seconds). This means that the angle between the top and right hand side boundary of the property is 89°00’30” and not exactly 90° (degrees).
This can have implications on the design of your home as in most cases, your home will be truly rectangular. It is valuable to seek the advice of a licensed surveyor before starting the design of your new house to avoid costly changes in the future.
Land Area
The land area is shown in the middle of the land and indicates the true size of your property as determined by the licensed surveyor.
In the case of our example boundary survey plan, the land area is 781m². In some cases, this measurement may differ from the size that your land title shows, or what someone has told you.
The land area shown on a boundary survey plan that is signed by a licensed surveyor is the true size of your land. Only a certified survey of the boundaries that is lodged at the Lands Titles Office for approval and deposit is more accurate.
Land Parcel Details
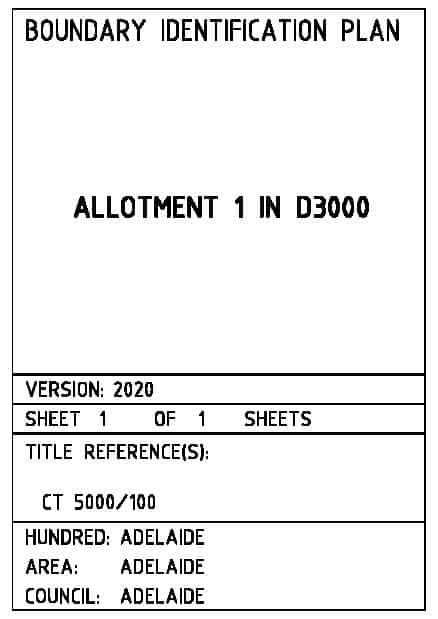
A boundary survey plan will always show the details of your property such as the Certificate of Title number, the allotment number and the existing survey plan number.
Please note that the image shown is an example only and is not a true reflection of an actual property in South Australia.
In our example, the parcel we are looking at is located in Allotment 1 of Deposited Plan 3000.
The Title Reference for our parcel of land is CT 5000/100.
The plan will also tell you the hundred, area (suburb) and the Council that the site is located in. This can help you identify the location of the property among the other details shown on the plan.
Our example boundary survey plan shows that the parcel is located in the Hundred of Adelaide as well as the suburb of Adelaide and the Council of the City of Adelaide.
Survey Marks Placed
A licensed surveyor will often place boundary marks on the ground to help you, or your on site contractors identify the true location of your boundaries with or without the help of the associated boundary survey pegging plan.
Where possible, these parks will be placed on the corners of your boundaries.
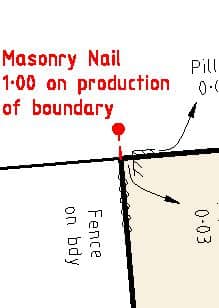
As is the case with the image to the left, it is also common for a boundary mark to be placed 1 metre in front of your property in line with the boundary. This allows you to easily replace the fencing along that boundary without removing the mark.
In the example to the left, a masonry nail (indicated as a red dot) has been placed 1 metre in front of the property, but in line with the western boundary. The nail is most likely in the footpath and at the time of the survey was probably also sprayed with paint so it is easier for you to find.
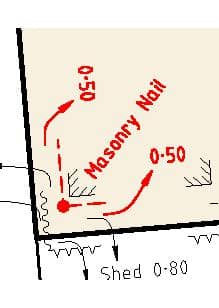
At the back of the property (or the bottom of our boundary survey plan) the marks were not able to be placed on the corner of the boundary because of some fencing in the way.
Instead, the mark has been placed 0.50 metres (or 50cm) from the west and south boundaries in the corner of the allotment.
The red dot indicates the masonry nail that has been placed while the red arrows indicate the distance between the red dotted line, and the boundary (which is 0.50 metres).
Different types of marks are placed in different situations. We will write a future article about the different types of survey marks that could be placed in a boundary survey process.
In the case of our plan, a metal pin was also placed in the bottom right hand corner of the property. This was also placed 0.50 metres from the east and south boundaries of the property.
Boundary Occupation
Often, the main purpose of a boundary survey is to find out if there are any encroachments into or out of your property.
On our example boundary survey plan we will focus on the boundary at the bottom of the page. An image is provided below.
As you can see, there is quite a bit of data to see on this plan which can be overwhelming when trying to read the plan correctly.
On our example boundary survey plan, there are 4 different sets of data that we will explain:
- Occupation
- Fences
- Buildings/Sheds
- Arrows
- Text/Measurements
- Boundary Marks
1. Occupation
On the image of the left hand side of our example boundary survey plan there are three different types of occupation that have been identified:
- Carport
- Fences
- Shed
Fences are shown on the plan as lines that look a little like zig-zags or wavy lines.
The fences shown on the plan are an indication of the location of the fence in relation to the boundary but are not necessarily drawn to scale.
If the fence/line is shown within your land (the shaded yellow area) then the fence is encroaching into your property.
Similarly, if the fence/line is shown outside of your property then the fence is encroaching onto your neighbour’s land.
The corners of the shed and the carport on the plan are shown as an L-shape with lines above it. The same symbol is used for both.
The outline of the whole shed, carport or building is rarely shown, rather only the corners of the building are shown as that is what has been measured by the surveyor.
You will notice that 3 corners of the shed have been measured, but only 1 corner of the carport has been measured.
All buildings or other concrete structures are usually also shown with this L-shaped symbol.
2. Arrows
The arrows shown on the plan indicate that a measurement next to that arrow relates to the space between the occupation (fence, shed etc.) and the boundary (in most cases).
On the far left of our example, you can see an arrow pointing to “Shed 0.58” and another pointing to “Fence 0.11”.
The start of the arrow is between the boundary and the corresponding occupation.
3. Text/Measurements
Following on from the above, the text showing “Shed 0.58” indicates that the Shed is 0.58 metres (58cm) from the western boundary (left hand side), and is inside the property.
Similarly, the text showing “Fence 0.11” indicates that the fence is 0.11 metres (11cm) from the western boundary.
As the wavy line for the fence is shown inside our property, we therefore know that the fence is 11cm inside our land.
On the left hand side of the bottom boundary there is an arrow pointing to text showing “Fence 0.15”. The wavy fence line is outside of our property. This means that the fence is 15cm into our neighbours land at that point.
Next to this, an arrow is shown pointing to the text “Shed 0.8”. The start of the arrow is within our yellow subject land, and therefore shows us that the shed is 80cm inside our true property boundary on our land.
You will notice that on the right hand side of the shed the arrow points to text that reads “Shed 0.78”. This means that the shed is 78cm inside our property and must therefore not be built parallel to the boundary, as it is closer than the other side of the shed was.
On the right hand side of the plan, you can see that a wavy line is drawn right on the boundary. The text below it reads “Fence on bdy”.
This means that the fence is located exactly on the true boundary of the property at that point.
So while the fence was inside our neighbours property at the bottom left hand side of our property, it comes back to be on the boundary at the bottom right hand side of our property.
This is a common occurrence and would usually be fixed if you are proposing new fencing on the property.
4. Boundary Marks
As previously discussed, the boundary marks and related measurements are shown on the plan in red.
The arrows and measurements for these marks show their relationship from the true boundary of the property. They do not show any relationship to the existing fencing or the shed.
North Point and Scale
A northpoint is shown on the plan in the top left hand corner. This helps you to identify the location of your property and will show anyone reading the plan where north is.
Your architect or designer will often need to know where north is located so that they can orientate their design in relation to the sun, but also to ensure the boundaries on their plan are plotted correctly.
Likewise, a scale bar is shown on the plan to ensure the correct scale is used when measuring anything manually from the plan.
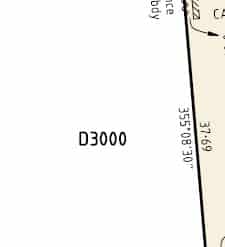
Neighbouring Land Identifiers
Neighbouring land identifiers are shown on the plan as their survey plan number.
In the case of our example plan the plan indicated on the left hand side of our property (D3000) would be Deposited Plan 3000.
On the right hand side of our property the plan S1000 would indicate that that property contains Strata Plan 1000.
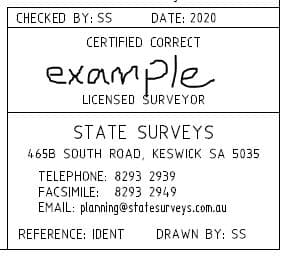
Licensed Surveyor Signature
A boundary survey is only valuable if it has been signed by a Licensed Surveyor.
Our example plan has not been signed by a Licensed surveyor (as this is an example only) however the image to the right show gives an indication of what this looks like.
You may receive a plan that titled “Boundary Survey” or similar however unless that plan has been signed by a Licensed Surveyor on the Register provided by the Surveyors Board of SA, it is not an accurate representation of the true location of your property boundaries.
Discuss your Boundary Survey with a Licensed Surveyor
If you have read our guide and still have questions, your surveyor will be more than happy to assist. If you cannot get in contact with the Licensed Surveyor that signed your plan, staff in their office should also be able to assist you.